I observed large fraction reads from intronic regions in my total RNA-seq data. Considering that many Alu elements are located in introns, I want to check the TEs in RNA-seq data.
I will first go through tools avaiable for analysis TEs in RNA-seq data, then use two of them to quantify TEs in test or real data.
Tools avaiable
Tools for the analysis of TEs (or REs) in RNA-seq data can be divided into three categories based on their function/purpose:
- Quantification of TEs (also compare the expression of TEs from different conditions)
- RepEnrich, TEtranscripts, SalmonTE
- Analyze TE involved transcript (find them, quantification, compare)
- LIONS, CLIFinder
- others
- IM-Fusion
I will introduce them by the order of their publication dates.
RepEnrich
RepEnrich is a method to estimate repetitive element enrichment using high-throughput sequencing data.
Its paper:
Criscione SW, Zhang Y, Thompson W, Sedivy JM, Neretti N. Transcriptional landscape of repetitive elements in normal and cancer human cells. BMC Genomics. 2014;15:583. doi:10.1186/1471-2164-15-583
RepEnrich uses the repeatmasker files which can be downloaded from repeatmasker.org or UCSC genome table browser. It first sets up the annotations, then maps the FASTQ files to genome using Bowtie1, and finally computes count of TEs. Examples in the docs are very detailed and also provide R codes of using edgeR for differential enrichment analysis.
RepEnrichread mapping strategy. Reads are mapped to the genome using the Bowtie1 aligner. Reads mapping uniquely to the genome are assigned to subfamilies of repetitive elements based on their degree of overlap to RepeatMasker annotated genomic instances of each repetitive element subfamily. Reads mapping to multiple locations are separately mapped to repetitive element assemblies – referred to as repetitive element psuedogenomes – built from RepeatMasker annotated genomic instances of repetitive element subfamilies.
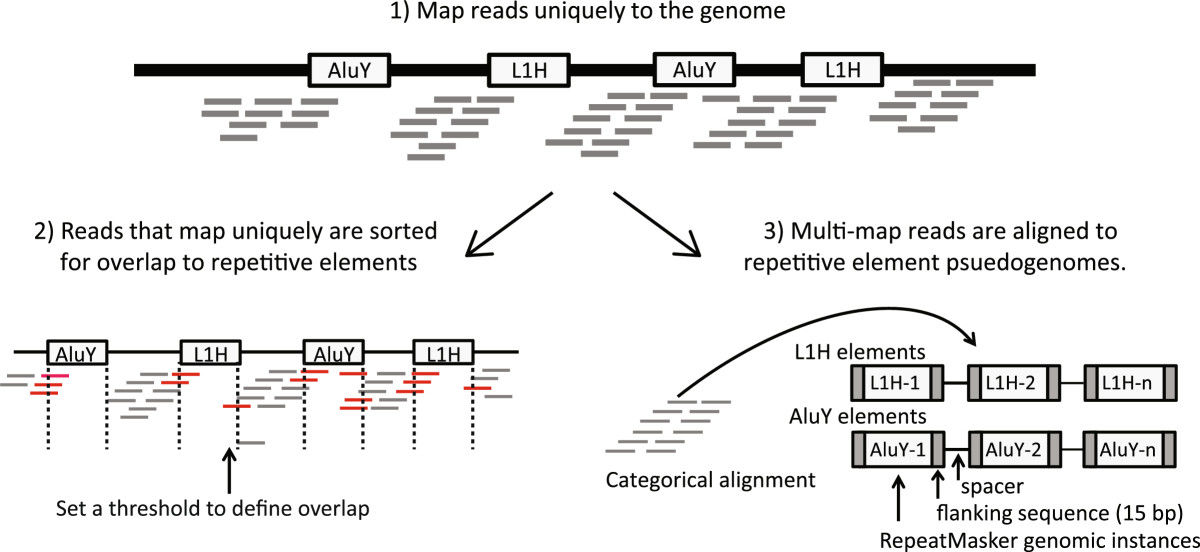
In the RepEnrich paper, the authors also analyzed data from ChIP-seq, they found:
We show that many of the Long Terminal Repeat retrotransposons in humans are transcriptionally active in a cell line-specific manner. Cancer cell lines display increased RNA Polymerase II binding to retrotransposons than cell lines derived from normal tissue. Consistent with increased transcriptional activity of retrotransposons in cancer cells we found significantly higher levels of L1 retrotransposon RNA expression in prostate tumors compared to normal-matched controls.
TEToolkit/TEtranscripts
TEToolkit is a software package that utilizes both unambiguously (uniquely) and ambiguously (multi-) mapped reads to perform differential enrichment analyses from high throughput sequencing experiments. Currently, most expression analysis software packates are not optimized for handling the complexities involved in quantifying highly repetitive regions of the genome, especially transposable elements (TE), from short sequencing reads. Although transposon elements make up between 20 to 80% of many eukaryotic genomes and contribute significantly to the cellular transcriptome output, the difficulty in quantifying their abundances from high throughput sequencing experiments has led them to be largely ignored in most studies. The TEToolkit provides a noticeable improvement in the recovery of TE transcripts from RNA-Seq experiments and identification of peaks associated with repetitive regions of the genome.
Its paper:
Jin Y, Tam OH, Paniagua E, Hammell M. TEtranscripts: a package for including transposable elements in differential expression analysis of RNA-seq datasets. Bioinformatics. 2015;31(22):3593–3599. doi:10.1093/bioinformatics/btv422
TEToolkit includes two tools:
TEtranscriptsquantifies both gene and transposable element (TE) transcript abundances from RNA-Seq experiments, utilizing both uniquely and ambiguously mapped short read sequences. It processes the short reads alignments (BAM files) and proportionally assigns read counts to the corresponding gene or TE based on the user-provided annotation files (GTF files).TEpeaksidentifies regions enriched for protein binding or modification to repetitive DNA and RNA sequences. It has been utilized in a variety of high throughput sequencing experiments, such as ChIP-Seq, CLIP-Seq and RIP-Seq. The tool performs peak calling utilizing a method that extends the approach implemented by MACS, utilizing ambiguously mapped reads and bin-correlation normalization to identify narrow enriched repetitive regions typically missed by standard approaches. Differential peak enrichment can also be performed to identify regions of differential protein-association in high throughput sequencing experiments.
TEtranscripts is suitable for my purpose. It uses BAM files generated by other software, and the author recommended that users identify the optimal parameters for their particular genome and alignment program in order to get the best results.
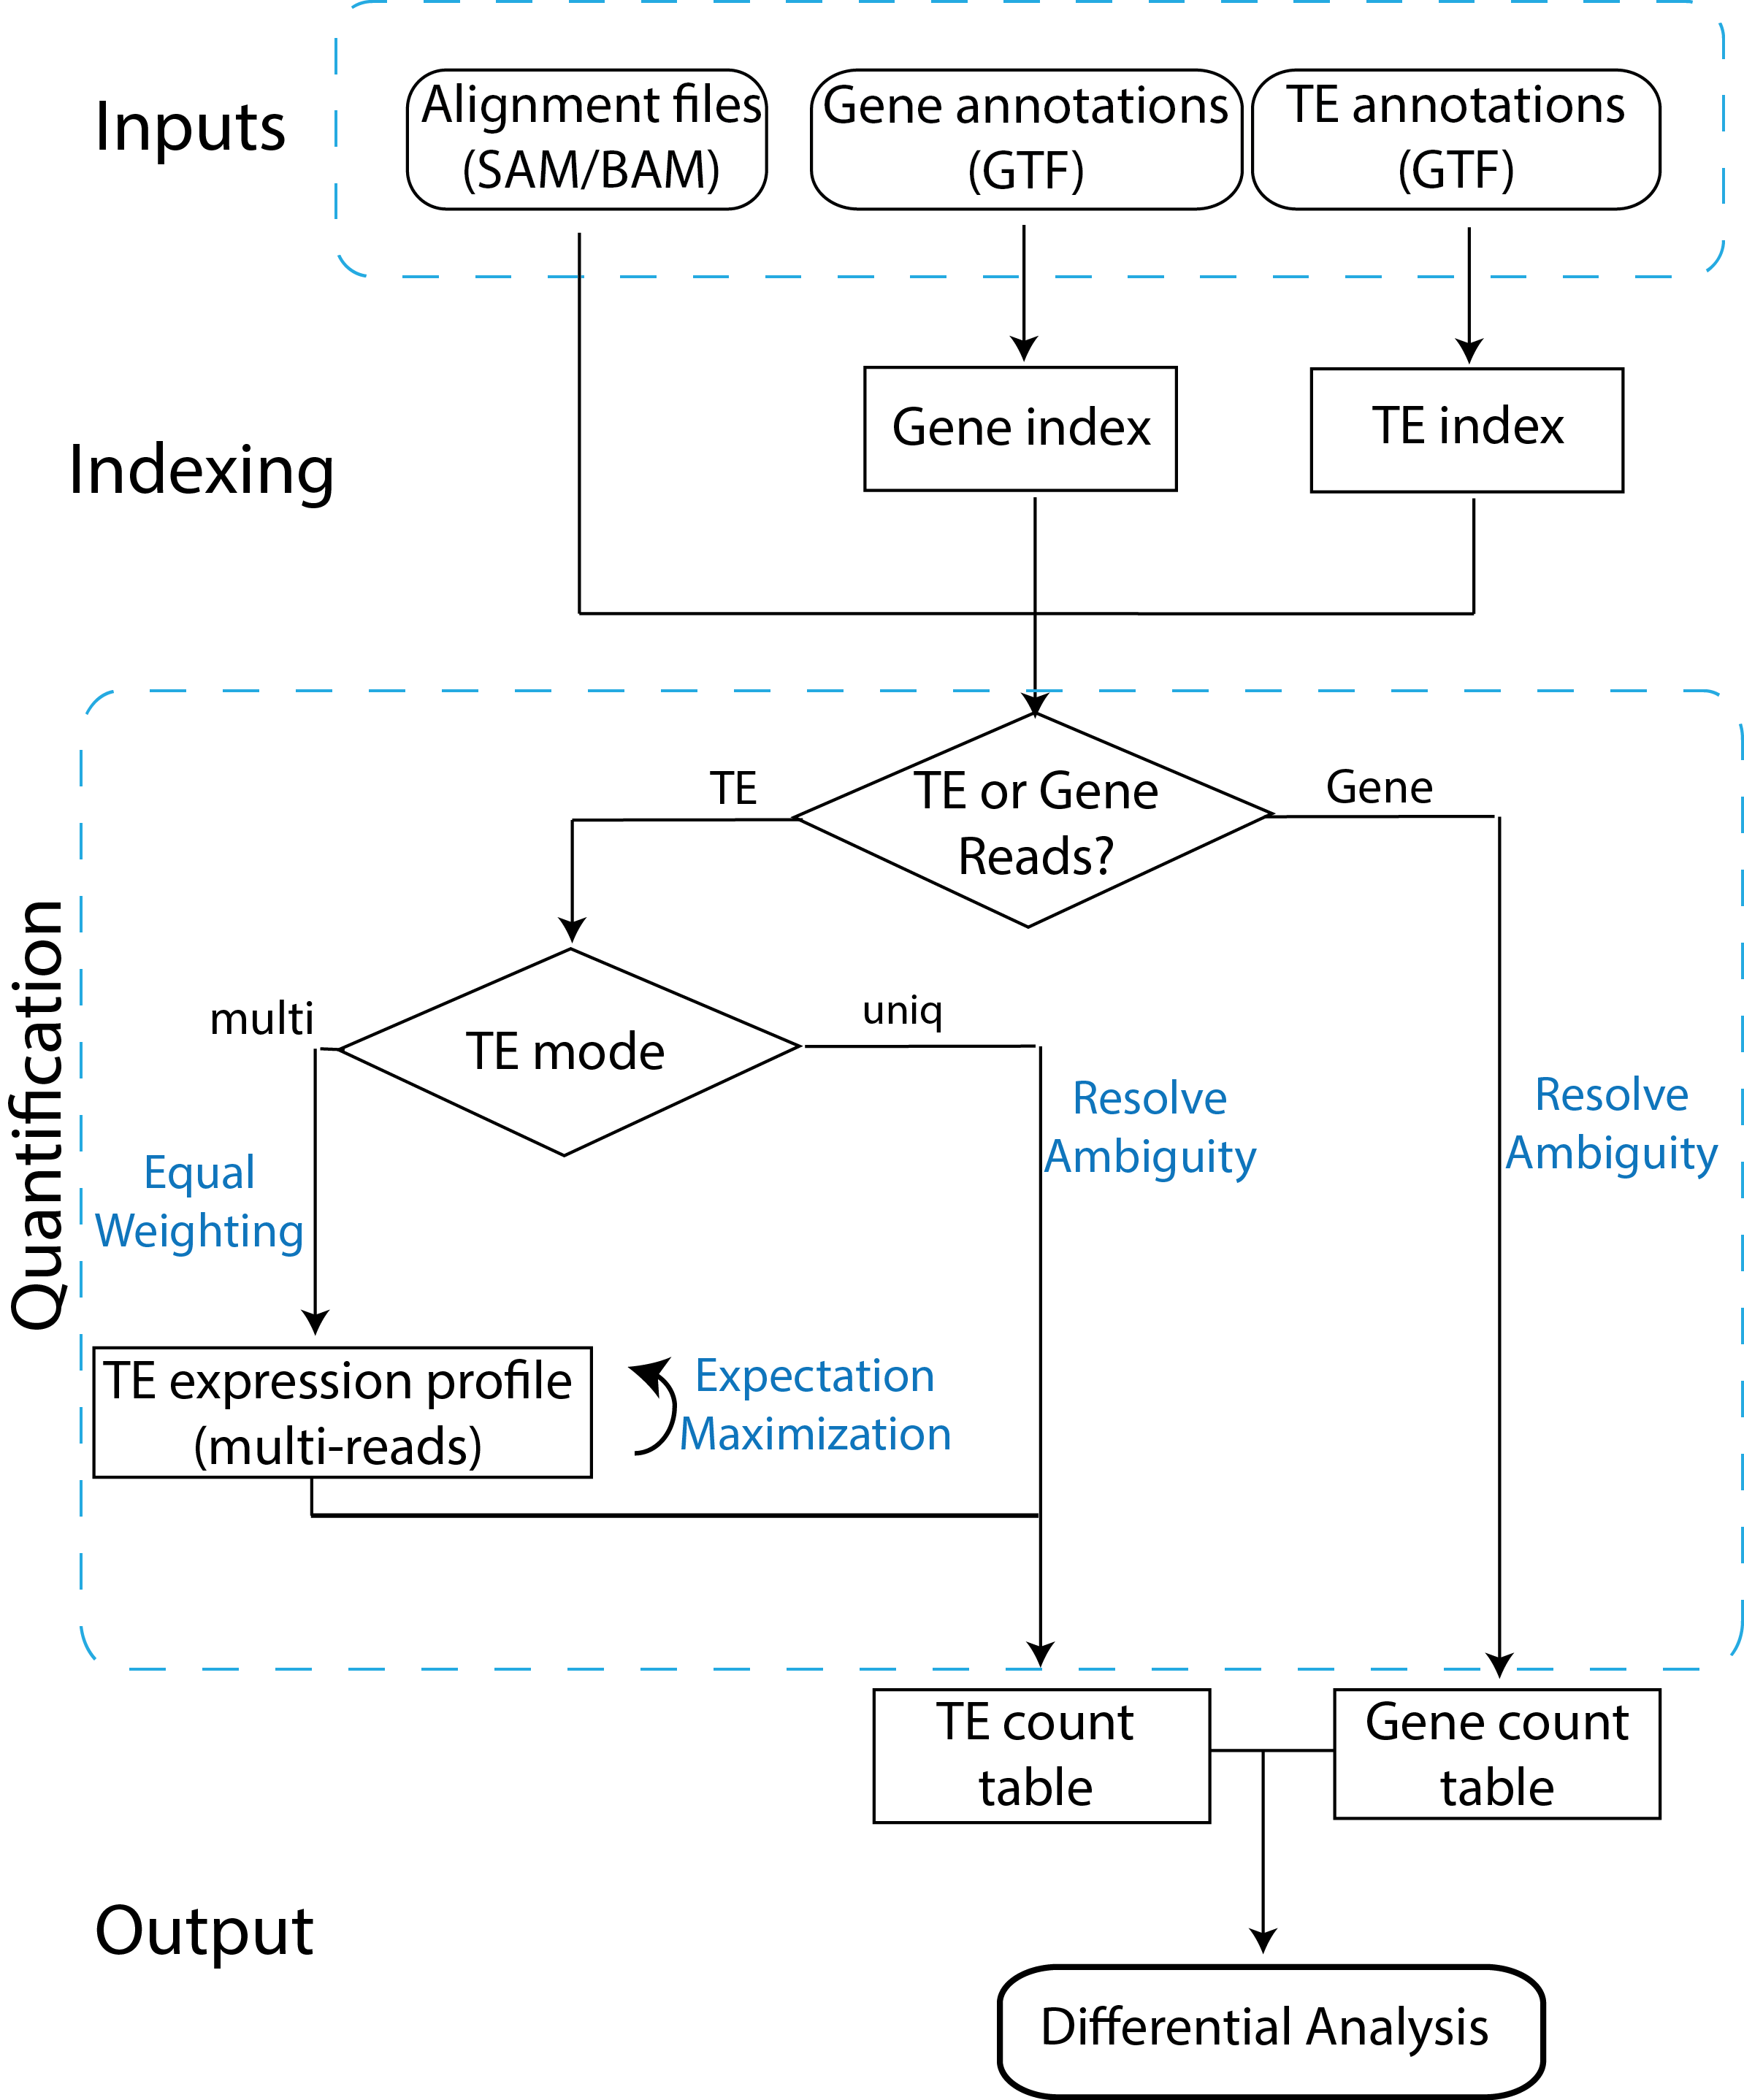
TEtranscriptsflow chart. Reads mapping to TEs are assigned in two different modes: uniq (reads mapping uniquely in the genome), and multi (reads mapping to multiple insertions of TEs). In the multi mode, an iterative algorithm is used to optimally distribute ambiguously mapped reads. Figure was downloaded from here.
rprofile/rop
rprofile is part of rop, which is designed to find all the origin of RNA-seq reads (mapped/unmapped, human/non-human, etc.).
rprofileis disigned to profile repetitive elements of the human genome from RNA-Seq data.
Its paper:
Mangul S, Yang HT, Strauli N, Gruhl F, Porath H, Hsieh K, Chen L, Daley T, Christenson S, Andersen AW, et al. Comprehensive analysis of RNA-sequencing to find the source of 1 trillion reads across diverse adult human tissues. bioRxiv. 2017 Jun 12:053041. doi:10.1101/053041
It uses BAM file to profile REs in mapped reads. Not accurate, not for quantification, just for wider snapshot of RE fraction in RNA-seq data.
The annotation of TEs rprofile used now is just the one generated by TEtranscripts, only hg19 available. But we can create other TE annotations using makeTEgtf.pl script in TETookit.
LIONS
Introduction from Git repo:
LIONS is a bioinformatic analysis pipeline which brings together a few pieces of software and some home-brewed scripts to annotate a paired-end RNAseq library to detect TE-intiated transcripts.
Its paper:
Babaian A, Lever J, Gagnier L, Mager DL. LIONS: Analysis Suite for Detecting and Quantifying Transposable Element Initiated Transcription from RNA-seq. bioRxiv. 2017 Jun 14:149864. doi:10.1101/149864
The last paragraph of the “Backgroud” part describes it more clear:
To quantitatively measure and compare the contribution of TE promoters to normal and cancer transcriptomes we developed a tool that incorporates features of previous methods but significantly builds upon them. We were motivated to use paired-end RNA-seq data alone, a broadly available data- type, to rapidly measure TE-initiations and transcriptome contributions. With a defined set of TE- initiated transcripts in each library, commonalities and differences between sets of data (biological replicates) can be determined.
Its workflow:
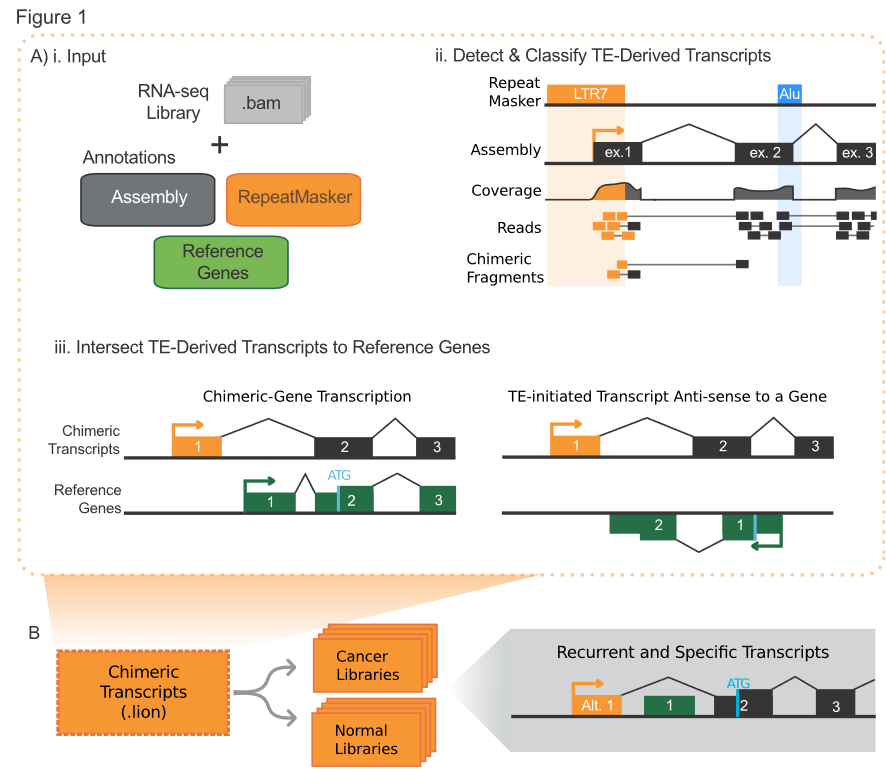
This tool has not been published yet (20180320). There are limited docs in its Git repo and so many dependencies (it bases on the transcriptome assembled by cufflinks, so I doubt its accuracy).
IM-Fusion
IM-Fusion is a tool for identifying transposon insertion sites in insertional mutagenesis screens using single- and paired-end RNA-sequencing data. It essentially identifies insertion sites from gene-transposon fusions in the RNA-sequencing data, which represent splicing events between the transposon and endogeneous genes.
IM-Fusion also identifies candidate genes for a given screen using a statistical test (based on the Poisson distribution) that identifies Commonly Targeted Genes (CTGs) – genes that are more frequently affected by insertions than would be expected by chance. To further narrow down a list of CTGs, which may contain hundreds of genes, IM-Fusion also tests if insertions in a CTG have a significant effect on the expression of the gene, which is a strong indicator of them having an actual biological effect.
Its paper:
de Ruiter JR, Kas SM, Schut E, Adams DJ, Koudijs MJ, Wessels LFA, Jonkers J. Identifying transposon insertions and their effects from RNA-sequencing data. Nucleic Acids Research. 2017;45(12):7064–7077. doi:10.1093/nar/gkx461
The abstract from its paper:
Insertional mutagenesis using engineered transposons is a potent forward genetic screening technique used to identify cancer genes in mouse model systems. In the analysis of these screens, transposon insertion sites are typically identified by targeted DNA-sequencing and subsequently assigned to predicted target genes using heuristics. As such, these approaches provide no direct evidence that inser- tions actually affect their predicted targets or how transcripts of these genes are affected. To address this, we developed IM-Fusion, an approach that identifies insertion sites from gene-transposon fusions in standard single- and paired-end RNA-sequencing data. We demonstrate IM-Fusion on two separate transposon screens of 123 mammary tumors and 20 B-cell acute lymphoblastic leukemias, respectively. We show that IM-Fusion accurately identifies trans- poson insertions and their true target genes. Fur- thermore, by combining the identified insertion sites with expression quantification, we show that we can determine the effect of a transposon insertion on its target gene(s) and prioritize insertions that have a significant effect on expression. We expect that IM-Fusion will significantly enhance the accuracy of cancer gene discovery in forward genetic screens and provide initial insight into the biological effects of insertions on candidate cancer genes.
Overview of IM-Fusion:
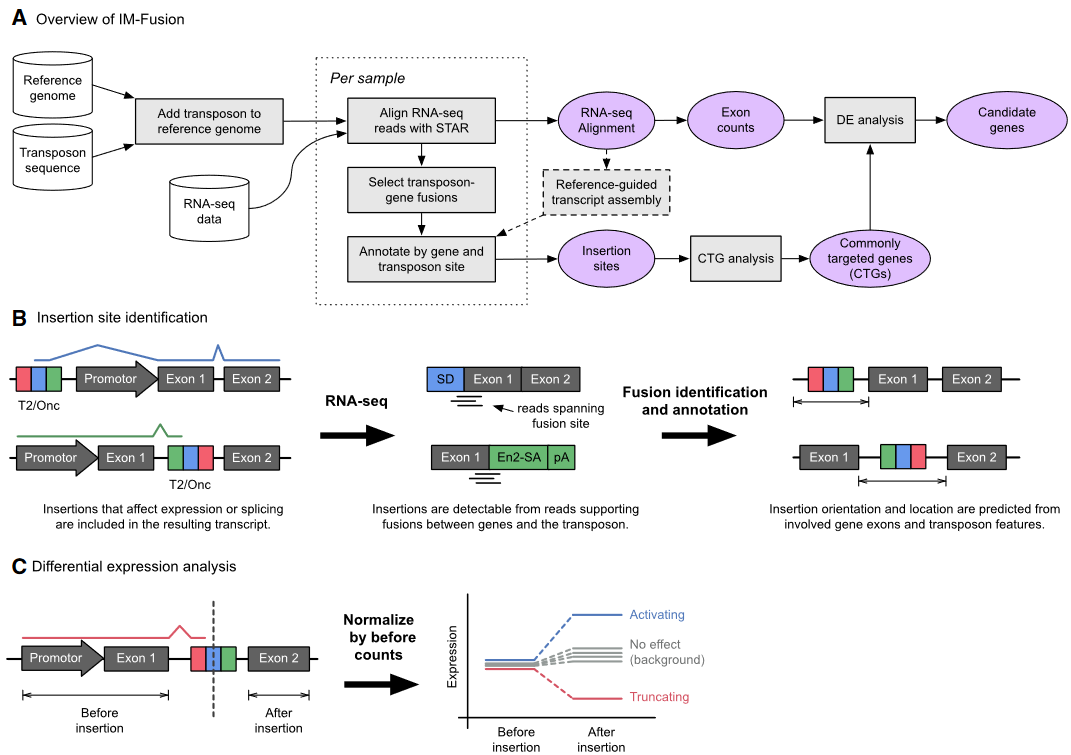
I do not know what is “Insertional mutagenesis using engineered transposons”. So I do not know when to use this tool. It seems that IM-Fusion does not suit me.
CLIFinder
L1 Chimeric Transcripts (LCTs) are initiated by repeated LINE-1 element antisense promoters and include the L1 5′UTR sequence in antisense orientation followed by the adjacent genomic region. LCTs have been characterized mainly using bioinformatics approaches to query dbEST. To take advantage of NGS data to unravel the transcriptome composition, we developed Chimeric LIne Finder (CLIFinder), a new bioinformatics tool. Using stranded paired-end RNA-seq data, we demonstrated that CLIFinder can identify genome-wide transcribed chimera sequences corresponding to potential LCTs. Moreover, CLIFinder can be adapted to study transcription from other repeat types.
CLIFinder v0.4.1 is a Galaxy tool, specifically designed to identify potential LCTs from one or several oriented RNA-seq paired-end reads in the human genome.
CLIFinder v0.4.1 is customizable to detect transcripts initiated by different types of repeat elements.
Its paper:
Pinson M-E, Pogorelcnik R, Court F, Arnaud P, Vaurs-Barriere C. CLIFinder: Identification of LINE-1 Chimeric Transcripts in RNA-seq data. Bioinformatics. 2017 Oct 23 [accessed 2017 Nov 2]. https://academic.oup.com/bioinformatics/article/doi/10.1093/bioinformatics/btx671/4562333. doi:10.1093/bioinformatics/btx671
It is a Galaxy tool, so…(we do not have Galaxy installed on the computer cluster.)
SalmonTE
SalmonTE is an ultra-Fast and Scalable Quantification Pipeline of Transpose Element (TE) Abundances.
Its paper:
Jeong H-H, Yalamanchili HK, Guo C, Shulman JM, Liu Z. An ultra-fast and scalable quantification pipeline for transposable elements from next generation sequencing data. In: Biocomputing 2018. WORLD SCIENTIFIC; 2017. p. 168–179. http://www.worldscientific.com/doi/abs/10.1142/9789813235533_0016. doi:10.1142/9789813235533_0016
Below is its working pipeline, clear and simple!
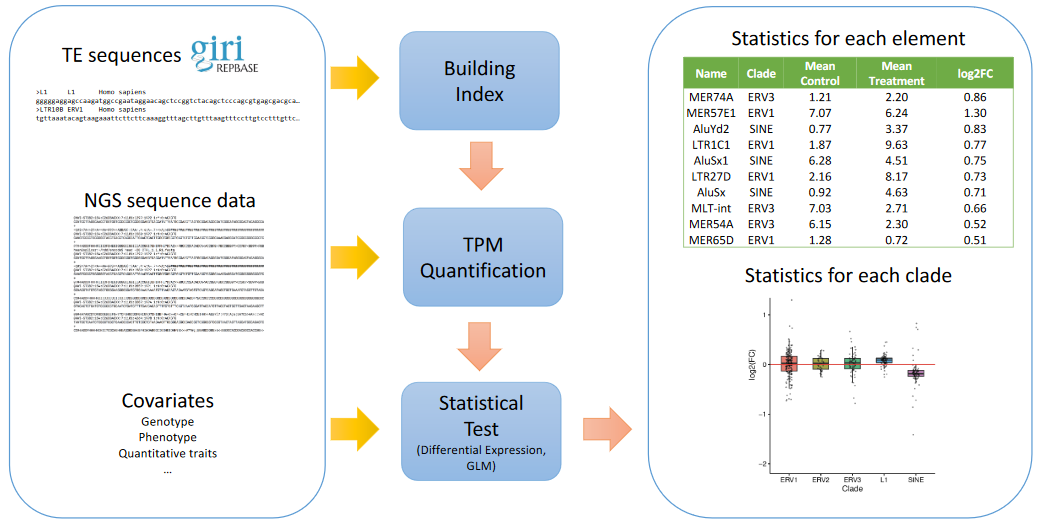
Pros. from its paper:
In contrast to TEtranscripts, SalmonTE starts with raw RNA-seq files, and does not need any additional pre-processing for a given sequence file. Moreover, TEtranscripts requires a modied GTF files based on RepeatMasker database. SalmonTE only needs the FASTA file of cDNA (complementary DNA) sequences of each TE.
SalmonTE is based on Salmon, which is a very fantastic tool for RNA-seq quantification. I will give it a try.
Summary
-
TE quantification:
RepEnrich: mapFASTQfiles to the genome usingBowtie1, use repeat annotation from repeatmasker.org or UCSC genome table browser, can also analyze ChIP-seq data.TEtranscripts: mapFASTQfiles to the genome using any alignment software (but need to tune the parameters), use a customGTFfile for repeat and gene annotation.SalmonTE: no need to align reads to genome, useSalmonfor TE quantification, only four species’ reference available now (hs, mm, dm, dr,20180320), base on annotation of Repbase (a website I do not like…), not easy to create customized reference.
-
TE involved transcript:
LIONS: limited docs.CLIFincer: a Galaxy tool
-
Other:
IM-Fusion
A little thoughts: all above tools for TE quantification may be inaccurate (the intrinsic drawback of short-reads mapping). Even SalmonTE does not need alignment, it may also deviate from reality. These tools maybe more suit for compasion of different conditions.
Using TEtranscripts for TE quantification
Install
Download zip file from tetoolkit release page
1 | unzip tetoolkit-1.5.0.zip && cd tetoolkit-1.5.0 |
So TEtranscripts is mainly for compare two conditions.
Prepare annotations
Download RepeatMasker tracks from UCSC Table Browser for pig: susScr11 and rhesus: rheMac8.
Then use makeTEgtf.pl from here to make GTF files for TE.
1 | perl ~/software/tetoolkit-1.5.0/makeTEgtf.pl |
Mapping reads to genome using STAR
There are detailed discussions about the parameters:
I have over 70 samples and have aligned reads to the genomes using STAR before. I do not want to align again…
The author provided some test files at this location. I will download BAM files of human for test.
1 | GTF |
Quantification
1 | ~/software/Python.2.7.13/bin/TEtranscripts --sortByPos --mode multi --TE hg19_rmsk_TE.gtf --GTF hg19_refGene.gtf --project pairedEnd_test -t test_data_PE_treatment.bam -c test_data_PE_control.bam 2> log |
Then got the following errors:
1 | ... |
Other users also found this bug: Problem with samtools. It was caused by pysam (>0.9) and samtools (>1.3). A solution is sorting the BAM files according to read names rather than by coordinates then feeding to TEtranscripts for now.
1 | samtools sort -@4 -O BAM -n test_data_PE_treatment.bam -o test_data_PE_treatment.sortedByReadname.bam |
There are four outputs of the above command:
1 | pairedEnd_test.cntTable # the count table (genes along with TEs) |
We can also use the count table for DE analysis.
Using SalmonTE for TE quantification
Install
Install Python3 modules:
1 | pip3 install snakemake docopt pandas |
Install R packages:
1 | install.packages(c("tidyverse", "cowplot", "scales", "WriteXLS")) |
Clone the repository
1 | git clone https://github.com/hyunhwaj/SalmonTE |
Add PATH of SalmonTE to your .bashrc file:
1 | export PATH=$PATH:/PATH_OF_SALMON_TE/ |
After sweating my blood (trying different R versions, different gcc versions, using callr 1.0 rather than callr 2.0), I installed all dependent R packages … I hate installing software.
Build index
SalmonTE now (20180320) provides pre-built reference for four species: human (hs), Mus musculus (mm), Danio rerio (dr), Fruit fly (dm).
It provides a doc about How to build a customized index, but when the species is not included in Repbase, it is not easy to create a index.
I asked the author about this: build index from species which is not available in Repbase, and there is no good solutions so far. There is also a thread talking about this: reference.
Well, I will just try SalmonTE for human.
Quantification
Then, I encountered another problem: SalmonTE only recognize .fastq and .fastq.gz extensions, but all my files end with .fq.gz. Even by using ln -s to create files with .fastq.gz extensions, it still went wrong.
1 | python3 /software/SalmonTE/SalmonTE.py quant --reference=hs clean_fastq/human |
This problem was also reported by other users: Nothing to be done, and it has not been solved. So I have to change the name my files…I have lots files.
1 | output count |
It was very fast. Using 16 threads, 22 samples took about 150 minutes.
The output count/TPM are just like what Salmon does. All samples are put into one file named EXPR.csv. We can use this file for downstream analysis.
Good.
Change notes
- 20180322: create the note.
- 20180323: add
rprofile.